by Tom Read
Since the beginning of the Industrial Revolution in the 18th century, the world has increasingly relied on technologies that emit greenhouse gasses. In the 20th century, economies shifted away from mechanical technologies and toward digital technologies that permeate nearly every industry and aspect of life. This large-scale adoption has caused greenhouse gas emissions to increase exponentially. These gasses have dangerously altered the Earth’s atmosphere, causing global temperatures to rise an average of more than 1C, and sea levels to rise 8-9 inches (21-24 cm).
In this article, we’ll take a close look at the source and scale of big tech’s emissions. We’ll also look at various sub-sectors and their impact, as well as the efforts tech companies are making to reduce their emissions.
An Overview of Tech’s CO2 Emissions
Since the beginning of the industrial age, the global average of Earth’s temperature has risen by 1.2C — and much of this rise can be attributed to CO2 emissions over the last century. Before we dive into the emissions of various niches of tech, let’s explore some significant stats across the industry.
#1: Global CO2 Emissions Continue to Be Staggeringly High
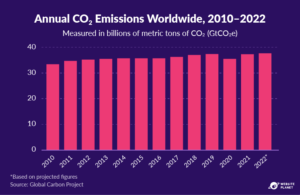
Total global carbon dioxide emissions have, by and large, been on the rise since the mid-1800s, and especially in the last decade. 2020 was a notable exception; the global pandemic caused many carbon dioxide-producing industries to be shut down for extended periods, causing total emissions to drop that year. Overall, 2021 saw emissions return to prior levels, with 2022’s figure being similar.
Compared to pre-industrial averages (prior to c. 1850), the Earth’s temperature has risen by an average of around 1.2 degrees Celsius — and with major climate agreements targeting a rise of 1.5C or less by the end of the century, these emission trends need to slow, and ideally reverse.
Many tech giants are playing their part in tempering their emissions, but before we can see meaningful change, companies across every industry must play their part.
#2: The Tech Industry’s Contribution to Global CO2 Emissions
Today, various forms of digital tech are deeply ingrained across all aspects of our daily lives. They’re in our smart watches, street lights, vehicle sensors, and nearly everything else. As a result, digital tech is currently responsible for 3.5% of all greenhouse gas emissions, with an energy consumption that’s rising by around 6% each year.
Emissions are often put into two categories: direct and indirect. For digital tech, direct emissions come from processes like manufacturing, logistics, procurement, and office upkeep. Here, emissions are directly caused by factories, vehicles, or things like keeping buildings heated.
Conversely, indirect emissions come from end-use power consumption, which has an implied emission cost. Even consumers simply scrolling their Twitter feeds have a measurable emission cost; for instance, charging the devices they’re using, the energy needed by the cell tower or Wi-Fi router they’re connected to, and the increased demand they’re placing on Twitter’s servers.
The largest culprits in the tech sector typically cause both significant direct and indirect emissions. For a real sustained improvement, we’ll need to see widespread shifts to greener energy.
#3: The Tech Industry Struggles to Contain Scope 3 Emissions
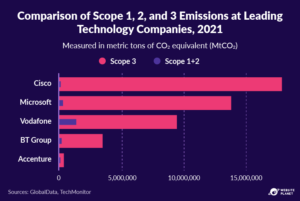
Scope 1 emissions are direct emissions: emissions as a result of fuel combustion, refrigerants, transportation, and manufacturing. Scope 2 are indirect emissions caused by the company in question due to their energy consumption and source.
Finally, Scope 3 emissions are the most tricky to track, as they’re the emissions that result from all up and downstream supply chain emissions related to the company — including logistics, employee business travel, and end-user consumption.
Because Scope 3 emissions are so difficult to track, you have to take self-reports of tech company emissions with a grain of salt — even if they’re trying to be above board, they may not have the full picture.
#4: Data Centers Demand a Huge Portion of Earth’s Electricity
The global energy consumption of data centers is a matter of serious concern. With an estimated 240-340 TWh used annually, this demand is significant enough to rival the total energy needs of many countries.
At present, the vast majority of this energy comes from fossil fuels that are detrimental to the planet. For one example, a data center hub in Northern Virginia — dubbed Data Center Alley — processes 70% of the world’s internet traffic. It’s unfortunately reliant on local power sources such as Dominion Energy — which largely runs on fossil fuels.
However, this reliance on fossil fuels may see a drop in the years to come, with many large tech companies placing a much higher emphasis on renewable energy sources.
#5: Better Technology Has Led to Far More Efficient Data Centers
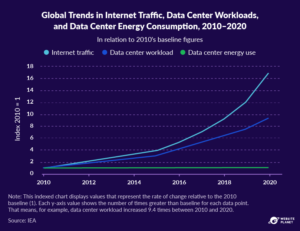
Despite rapidly growing internet traffic, and the subsequent increase in workloads for data centers, their energy usage remained fairly stable through the 2010s — albeit still, in absolute terms, an enormous amount of electricity.
This leap in efficiency needs to continue for data centers to maintain — or ideally, reduce — their carbon footprints in the future. This will also need to be paired with cleaner energy sources, which will mean that data centers need to operate in regions that have such energy sources readily available.
#6: Using Digital Technologies Consumes More Energy than Producing Them
55% of energy consumption is generated through usage. 45% is due to their production. It may seem counter-intuitive that digital technologies consume more energy for simply using them than they took to produce, but this just speaks to the sheer scale at which they’re used. Production is usually a short-lived process in which companies have a great deal of control and are incentivised to save money. Leaner processes with minimal waste in mining, refining, manufacturing, and transportation are also often relatively green, compared to use.
But these goods last for years and require energy not only for their own power, but also to connect to the web and store and retrieve data in the cloud. Keep in mind, however, that this is just an average across all digital technologies — over 90% of the emissions caused by mobile phones, for instance, are from their production and disposal, as they’re efficient devices that don’t require a lot of energy to power. On the other hand, products like TVs and laptops require a lot more energy to run, and as a result, use more energy than their production.
#7: Digital Technologies Use More and More Energy Every Year
Collectively, digital technologies consume 6% more energy every year. Annually, global e-waste production rises by 8%. As society’s dependence on digital technologies increases, so does the technologies’ total energy consumption. Additionally, companies develop tech products with a business model of planned obsolescence. Before a product is put on the market, companies often have a new model in the works with improved features, all but guaranteeing their users will look for upgrades in the future.
This contributes to the increasing amount of electronic waste being produced. In 2019 alone, 53.6 million metric tons of e-waste was produced — a figure that is projected to rise 30% by 2030. E-waste can be toxic and is not biodegradable, causing an environmentally harmful accumulation in landfills. Over time, toxic substances from this waste can leach into the soil, water, and air, causing irreversible damage. Additionally, e-waste is often burned, releasing toxic substances into the atmosphere.
#8: The ICT Sector’s Carbon Footprint Is Growing Exponentially
ICT (information and communications technologies) refers to all tech used for gathering, storing, transmitting, retrieving, and processing information. By 2025, information and communications technologies could use 20% of the world’s electricity. These technologies may be responsible for 14% of global greenhouse gas emissions by 2040. This is roughly equivalent to the total emissions caused by the world’s second-largest emitter today, the US.
These projections challenge the claim made by many large companies in the industry that they can increase efficiency and reduce waste, and instead anticipate the industry’s carbon footprint to continue its upward trend.
#9: Researchers Often Overestimate the Amount of Electricity Used by the IT Sector
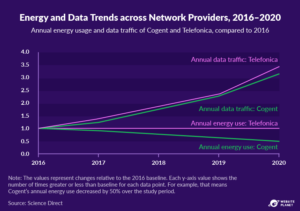
Telecom corporations have held their energy use relatively constant over the last decade, despite their data traffic consistently growing over time. This has defied predictions made by researchers in the past, who estimated that these energy usage figures would grow alongside their data traffic.
This is likely thanks to huge leaps in technology that allow far greater energy efficiency than researchers in the past thought possible. The inner workings of these mechanisms are proprietary, and telecom companies often keep the methods of their largest efficiency gains secret to maintain an edge over their competition.
The Best and Worst among the Tech Industry
The largest players in the tech industry have been making unequal progress toward reducing their emissions. In this section, we’ll take a closer look at the climate-oriented performance of some of the largest players in the industry, and the factors that influenced these results.
#10: Tech Giants Emit More than Many Midsized Nations
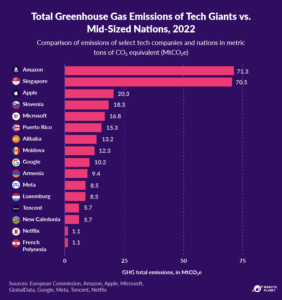
When we take a closer look at the total emission figures of some of the giants in the tech industry — counting emissions from Scope 1, 2, and 3 — the figures are rather shocking, surpassing the total emission figures of many countries in 2022. Many of these tech behemoths are making progress. Amazon, for instance, was responsible for slightly less greenhouse gas emissions in 2022 than it was in 2021, by the equivalent of around 0.3 million metric tons of carbon dioxide. While Amazon has made strides toward being more sustainable, such as powering 90% of its operations in 2022 with renewable energies, its total emissions still surpass that of all but around 20 countries worldwide.
#11: Amazon and Samsung Had the Highest Operational Emissions in 2021
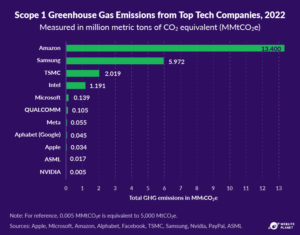
Looking at Scope 1 emissions alone, Amazon and Samsung were the largest carbon emitters in 2022, with many other similarly large companies emitting far less. To get a sense of its sheer scale, Amazon’s Scope 1 emissions were equivalent to the output of 2.9 million cars. Amazon did, however, pledge a strategy to achieve net-zero emissions by 2050. Despite this, it hasn’t achieved a great deal compared to other Big Tech companies like Meta and Alphabet, which already had Scope 1 emissions of less than a tenth of a million tons of carbon dioxide. In fact, Amazon’s Scope 1 emissions in 2022 were greater than its 2021 figure.
#12: Tech Giants Recognise Their Impact and Commit to Do Better
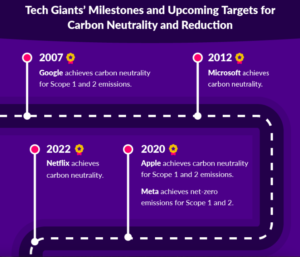
The major players in the tech industry are making varying amounts of progress toward achieving climate and sustainability goals.Carbon neutrality refers to companies offsetting their carbon emissions by purchasing renewable energy or carbon offsets, while net-zero refers to getting rid of all their emissions entirely. There can be a degree of ambiguity when talking about carbon neutrality, that is, whether the emissions in question are operational (scope 1 and 2) or across the entire value chain.Google, Microsoft, Apple, and Netflix have all been carbon-neutral for operational emissions since 2007, 2012, 2020, and 2022 respectively, but are still a long way off from being fully carbon-neutral, and a longer way still from being net-zero. Regardless, these companies are paving the way for a greener tech future.
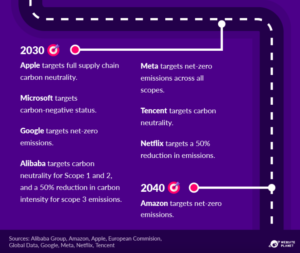
#13: Despite Its Net-Zero Pledge, Amazon’s Emissions Have Been Increasing
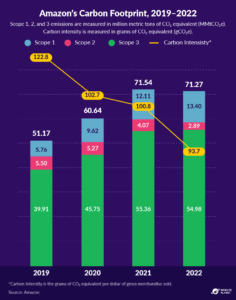
All of the Big 5 Tech companies — Amazon, Meta, Microsoft, Apple, and Alphabet — have pledged to be net-zero emitters by 2040.Despite making this pledge in 2019, Amazon’s greenhouse gas production has largely been on the rise over the last few years. However, in 2022, its figures suggest this trend may be slowing: while Amazon’s Scope 1 emissions grew, its Scope 2 and 3 emissions fell, bringing its total lower than its 2021 figure. It’s worth keeping in mind that experts have alleged that Amazon hasn’t been reporting its emissions from third-party vendors — if we include these emissions, the total figure is likely to paint a less optimistic picture.
#14: Semiconductor Manufacturers Emit the Most CO2 per Employee
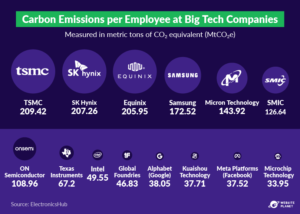
In absolute terms, Samsung was the largest emitter of carbon dioxide equivalent (CO2e). However, if you look at these figures on a per-employee basis, TSMC, SK Hynix, and Equinix had higher numbers, with Samsung not far behind.Some reasons for this could be that semiconductor manufacturing, in general, creates a lot of greenhouse gases, depending on the type of energy used.
Also, key components for semiconductor manufacture require rare earth metals such as silicon, gallium arsenide, and germanium — all of which create a lot of emissions to mine and refine. Equinix’s story is similar. Data centers create a lot of emissions, largely based on their power consumption, and Equinix is a behemoth in the data center space.
#15: Toshiba and Accenture Pave the Way for Greener Operations
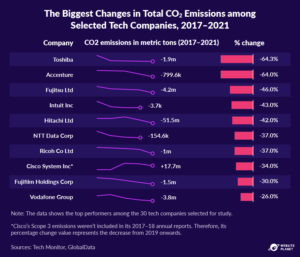
Between 2017 and 2021, Toshiba and Accenture each reduced their CO2 emissions by around 64%. This was a huge drop, both proportionally and in absolute terms — particularly for Toshiba, which decreased its emissions by 1.9 million metric tons of CO2e. Fujitsu made a sizable reduction in absolute terms, as well, with a drop of 4.2 MtCO2e.
While these companies are setting a stellar example, not all tech companies have shown this level of commitment toward reducing their carbon impact. The industry needs to make more progress on this front, particularly from companies in India and China, to meet international goals for emissions and warming.
#16: Indian Tech Giants’ Emissions Nearly Doubled Over Four Years
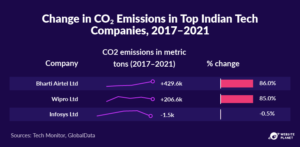
Many tech companies in India aren’t showing the same reduction in emissions as some of their Western counterparts. Currently, the infrastructure in India is reliant on dirtier energy sources, without many suitable clean alternatives. As a result, tech companies are often left with no alternative.
It’s worth keeping in mind that countries like India are at a different stage in their economic development than many Western countries. When countries from the developed West were at a similar stage of their economic development, they also relied on inexpensive, dirty energy sources like coal that were environmentally damaging. It was the heavy use of these unclean energy sources that helped the West build its current wealth.
#17: Comparing Tech Giants’ CO2 Emissions
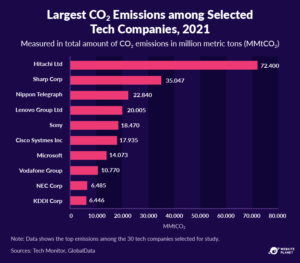
Few tech giants achieved as large a reduction in carbon dioxide emissions between 2017 and 2021 as Hitachi, both in proportional and absolute terms. It emitted 120 million tons of carbon dioxide in 2017 and nearly halved this figure by 2021. However, its emissions were still enormous, with over twice as much as the next largest emitter among those studied, Sharp.
For both multinational companies, the vast majority of their emissions came from Scope 3 — in particular, those from consumer usage after purchase. The other companies in this list of high-carbon impact players have all shown either marginal progress or regression.
Consumer Electronics
Today, consumer electronics are everywhere, from handheld devices to smart appliances. It may seem inconsequential on a micro-scale, but their cumulative emission cost — both to produce and to use — adds up. Let’s take a closer look at the facts surrounding consumer electronics.
#18: Consumer Devices Are Becoming More Efficient
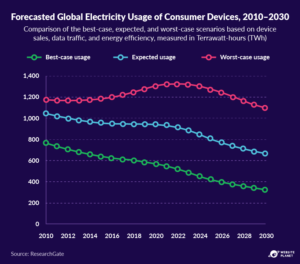
Consumer devices are expected to become increasingly ubiquitous with the increased adoption of the Internet of Things (the network of devices connected to, and exchanging data through, the internet). However, their total global electricity cost is forecast to drop. Some of the major factors contributing to this downward trend in the electricity use of consumer devices are advances in power-saving architectures, management, and technologies.
#19: Which Consumer Devices Use the Most Electricity?
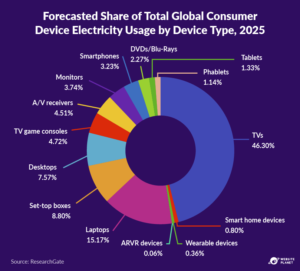
By 2025, consumer devices are expected to make up 2.8% of global electricity usage, which is more than the total predicted for fixed-access WiFi (0.3%), but less than that of data centers (4.5%).The consumer device power use both today and forecasted for 2025 is dominated by processing and displays — with televisions and their peripheral devices accounting for around 65% of the total, and computers and their peripherals accounting for around 25%.
#20: Digital Devices Consume Power Even When They’re Turned Off
Up to 40% of energy used by electronic devices is consumed while they are on standby. Standby power consumption accounts for up to 10% of global electricity use. Many home electronics devices like televisions, computers, refrigerators, and washing machines aren’t ever really fully turned off — instead, across all devices, they’re left on standby an average of around 75% of the time.When these devices are left on standby, they demand anywhere from 0.1 to 30 watts of power, and for many devices, this can be true even if they have, ostensibly, been fully turned off.
If standby power consumption of these devices could be lowered to 1 watt, this would lower annual carbon dioxide emissions by nearly 2 megatonnes — a huge savings.Additionally, users can help the cause by simply being more conscientious about their power use: using devices like smart power bars and simply unplugging devices when they’re not in use, rather than putting them on standby, can help.
#21: Electronic Device Emissions Jumped by over 50% between 2014 and 2020
From 2014-2020, emissions caused by electronic devices and their associated e-waste surged by 53%, reaching 580 million metric tons of CO2 in 2020 alone. In addition to creating a substantial carbon footprint, electronic waste also exposes over 30 million people to increased levels of toxic waste in the 32 cities that house large-scale e-waste recycling centers around the world. While all landfills contain varying levels of e-waste, the effects are most pronounced in these regions.
E-waste also changes the concentration of hazardous metals in the air, water, and soil at and around their disposal and recycling sites. Major governing bodies like the WHO and the EU set permissible standards for these metrics — and many of these sites report higher concentrations than recommended, causing an increased risk to people living in these regions.
Pinpointing the exact reason for the drastic surge in e-waste is challenging — however, it’s likely a combination of far more widespread electronic device usage, combined with consumers discarding electronics more frequently than in prior decades.
#22: Electronic Waste Has a Huge Impact; Better Legislation Can Help
Without action, e-waste could emit 852 million metric tons of CO2 annually by 2030. However, extending device lifetimes by 50-100% can cut annual e-waste emissions by up to 28 million metric tons of CO2. Planned obsolescence — the design choice by manufacturers for devices to only be used for a couple of years — combined with a culture of always getting the newest, shiniest devices, means that e-waste quantities are increasing at a faster and faster rate.
To mitigate the problem, educating people on the impact of their device use would be a good start: a study by the University of California, Irvine, found that by increasing device life cycles by 50 to 100 percent through reducing, reusing, and recycling, annual emissions resulting from e-waste can be cut by up to 28 million metric tons annually.
#23: Everyday Emails Have a Cost, Too
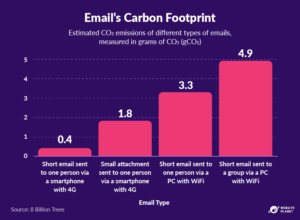
Sending an email requires energy. Energy is needed to power the devices you send it to and from. Plus, energy is needed to run the network and data centers that help store, transfer, process, and analyse each message. Certain factors may affect an email’s energy consumption and therefore emissions. Emails that contain attachments require more storage and take longer to process. Emails with multiple recipients are transferred, stored, and read more than once. Meanwhile, PCs use more energy than smartphones, hence why an email sent from one generates more emissions.
The author, Tom Read, is a Content Manager for Website Planet who specialises in creating meaningful and insightful content. He’s researched, written, and edited numerous articles for Website Planet, including a comprehensive guide to NFTs. Underlined by his major in English Literature, Tom calls upon a decade’s worth of experience with content to help deliver value to readers.